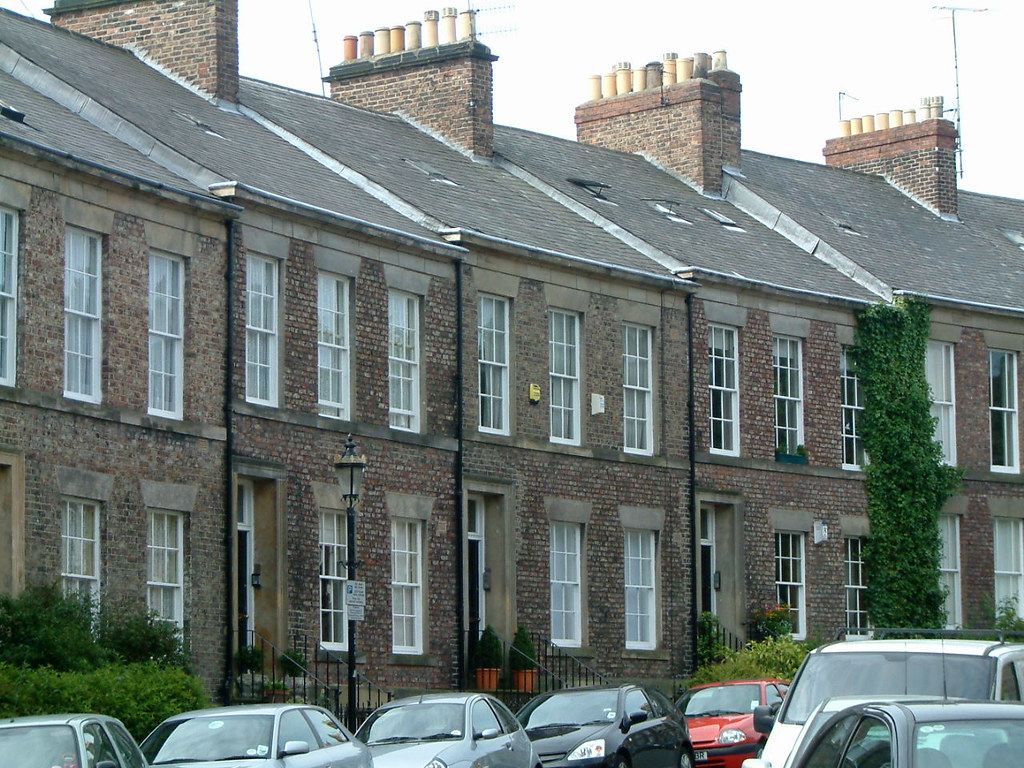
Newcastle is the most populated city in North-East England. It is a great metropolitan city which is always busy and bustling and it is also the home of the football team Newcastle United.
Over the decade from 2010 – 2019 a total of 151,000 houses were sold according to Land Registry data.
This article aims to identify some of the key trends in house prices in both terms of house price brackets, but also how transient each post code area is – in other words, which post code areas had the highest number of houses sold.
House price data by price bracket
Chart of Newcastle house sales price data for years 2010-2019
At the start of the decade, in the first quarter of 2010 house sales were at its lowest with 11423, this may be due to the global financial crisis at the time.
The highest year of house sales was 2017 with a total of 17839 of which was closely followed by 2018 with 17414.
At the start of the decade in 2010 the lower end of the property market sold for less than £100,000 the most houses with a total of 2565. At the end of the decade, this margin of the property market remained to be the highest bracket of which had the most houses sold with a total of 3424.
The house price bracket that came in second was between £200,000 and £300,000 with a total of 3272 houses being sold in 2019. This bracket had one of the largest increases in the number of houses being sold as at the start of the decade there were only 495 houses sold, of which may have been due to the recession at the time.
On the more expensive houses sales in Newcastle, there were 14 houses sold over £1 million in 2010. This amount stayed the same at the end of the decade with 14 houses being sold in 2019. However, in 2014 there was an increase of which 22 houses were sold and in 2017 there were 23 sold over £1 million
Newcastle house price data by postcode area
Chart of Newcastle house price data by post code for years 2010-2019
In terms of the volume of house sales in a particular postcode district, the NE3 postcode district which represented Gosforth, Fawdon, Kingston Park and Great Park (East) was overall the area with the highest number of house sales which was 7176 over the decade between 2010 and 2019.
Newcastle has a high amount of postcode districts with a grand total of 61.
Other postcode areas within Newcastle followed closely behind NE3, as NE28 had 5427 houses sold and the NE5 district followed closely with 5217 houses sold over the decade.
Real time Newcastle house price information
If you are interested, you can see what the current selling prices for different types of houses & flats for sale in Newcastle are here on the Propertyheads website, including 4 bedroom houses for sale, 1 bedroom flats for sale and also houses and flats to rent.
We also have a number of Newcastle estate agents who are available to chat through your property needs using our innovative messaging facility.
Added: June 16, 2020 07:49:02